English
English
When something looks wrong in production — an activity not showing up where you expected, the wrong agent attributed, a value that should be filled but isn't — the trace viewer is where you start. It shows you exactly what happened on a specific run of the processor against a specific source model: which instructions ran, what each one received, what it produced.
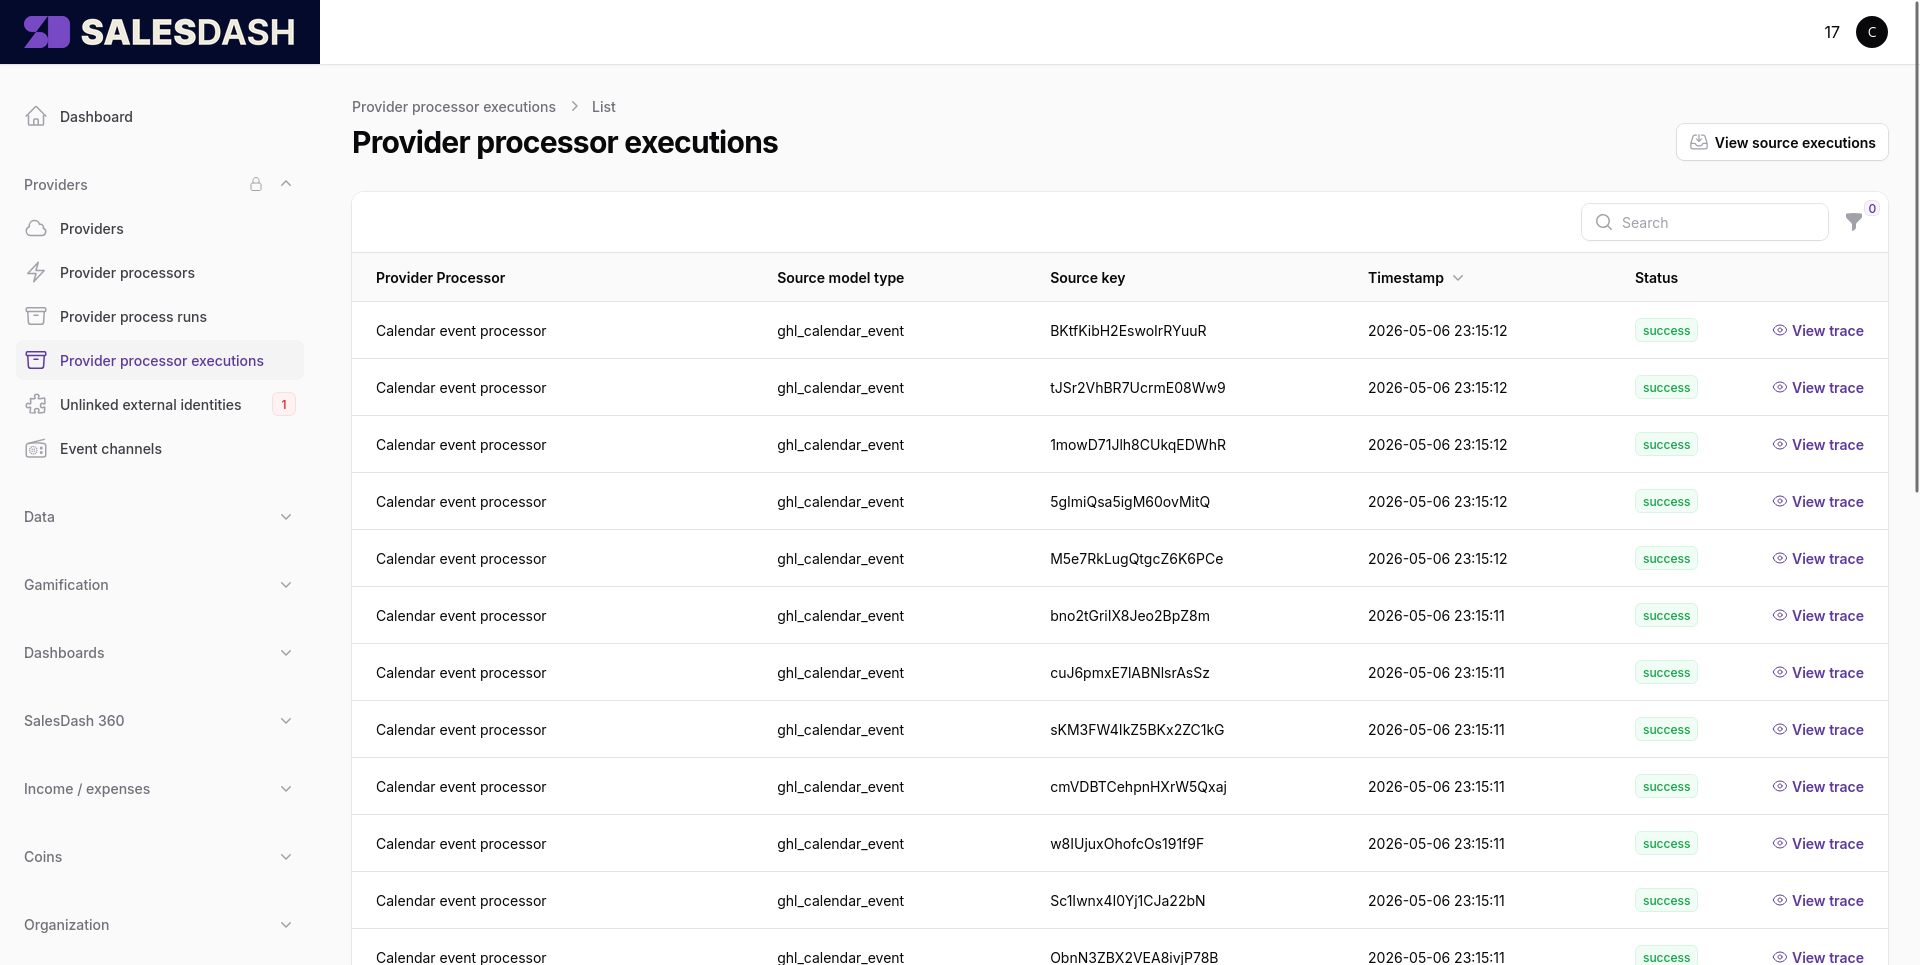
Every time a source delivers a record to a processor, SalesDash records the run as a processor execution. They're listed under Providers → Processor Executions, sorted with the most recent first. Each row shows the processor that ran, the source model it ran against, when it ran, and whether it succeeded.
Click any row's View trace link to open the trace viewer for that execution.
The trace viewer is the same three-panel layout as the Spec Builder, with execution data overlaid on it.
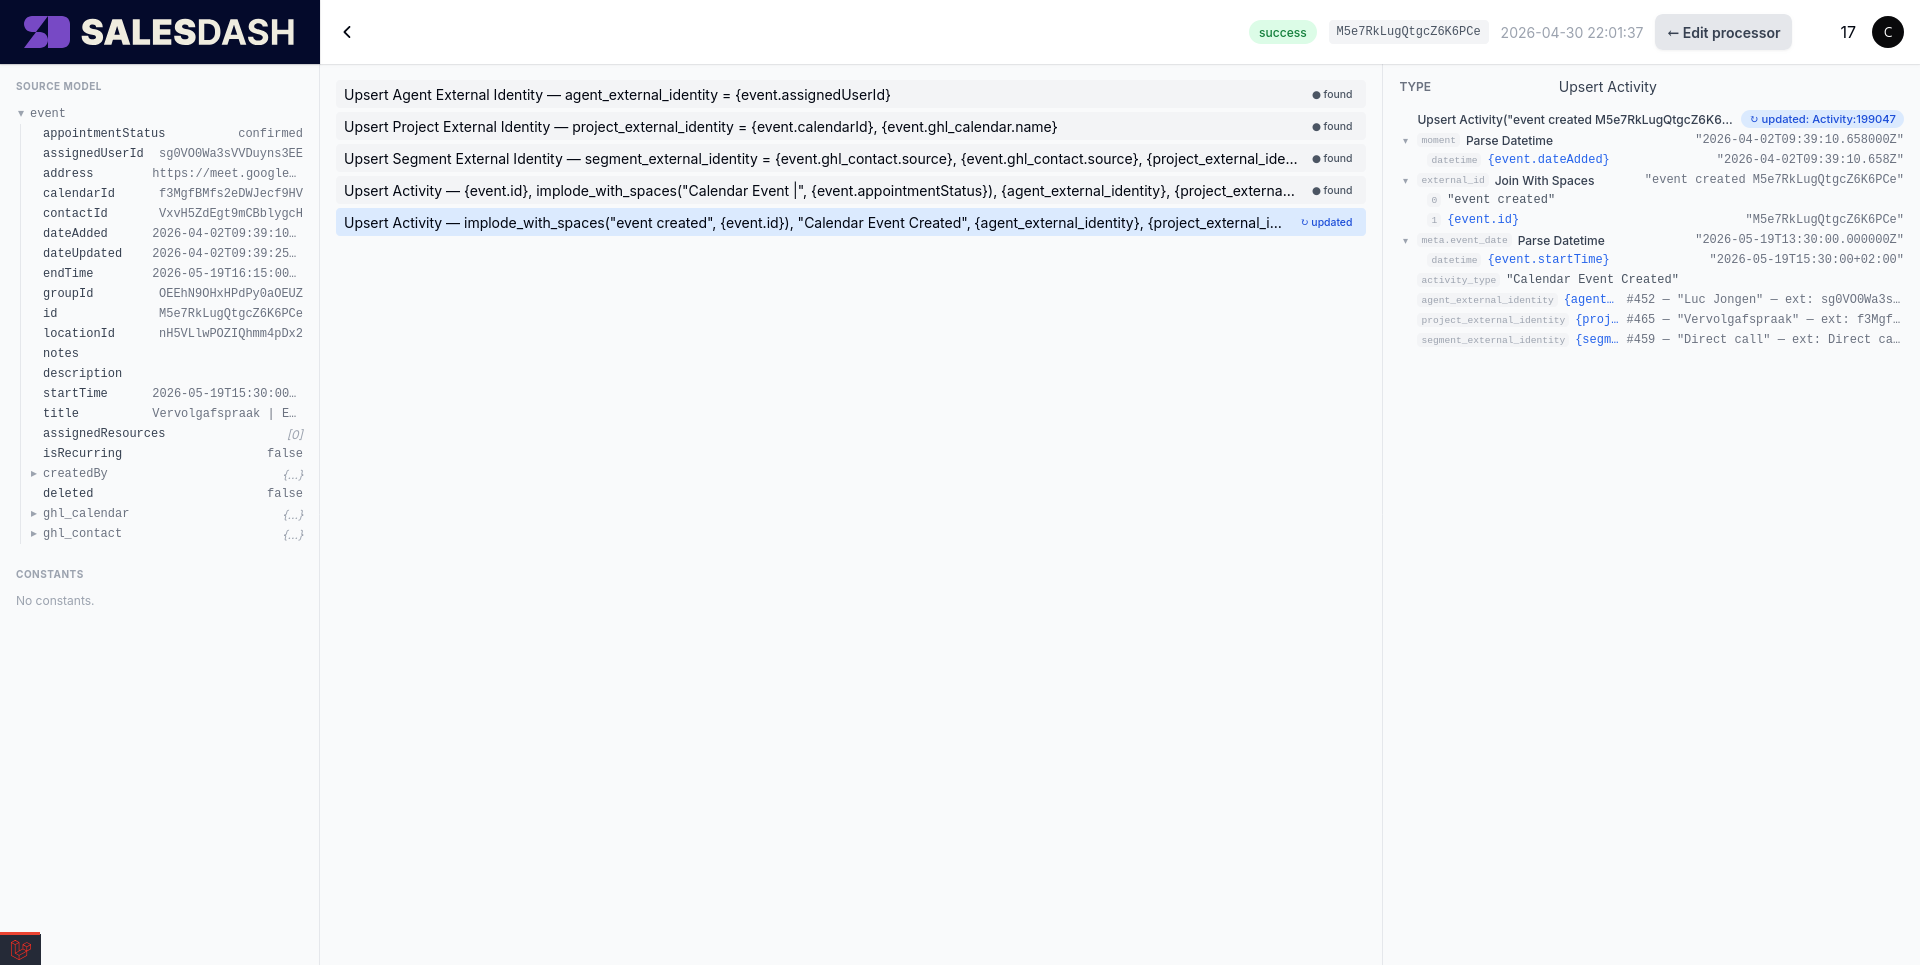
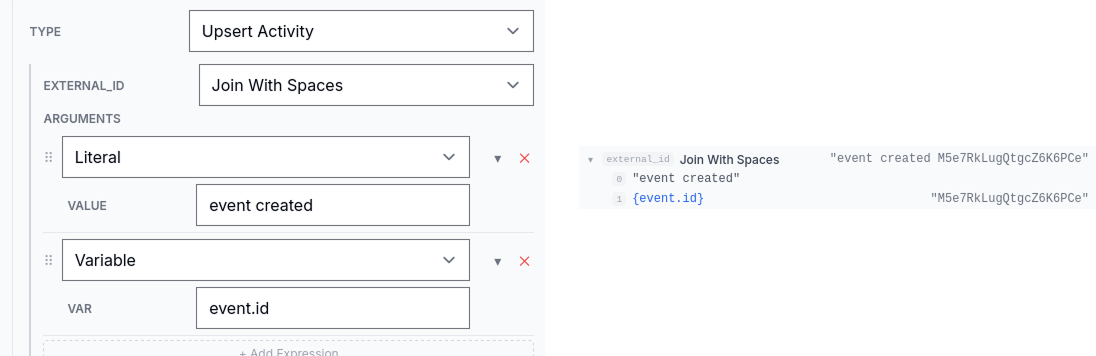
found / updated next to upserts, the chosen branch on an if_else, the iteration count on a for_each, and any error messages in red.The expression tree on the right is what you'll come back to most often when debugging — when an external_id or activity_type doesn't look right in production, expanding the expression in trace mode shows you which sub-expression produced the wrong value.
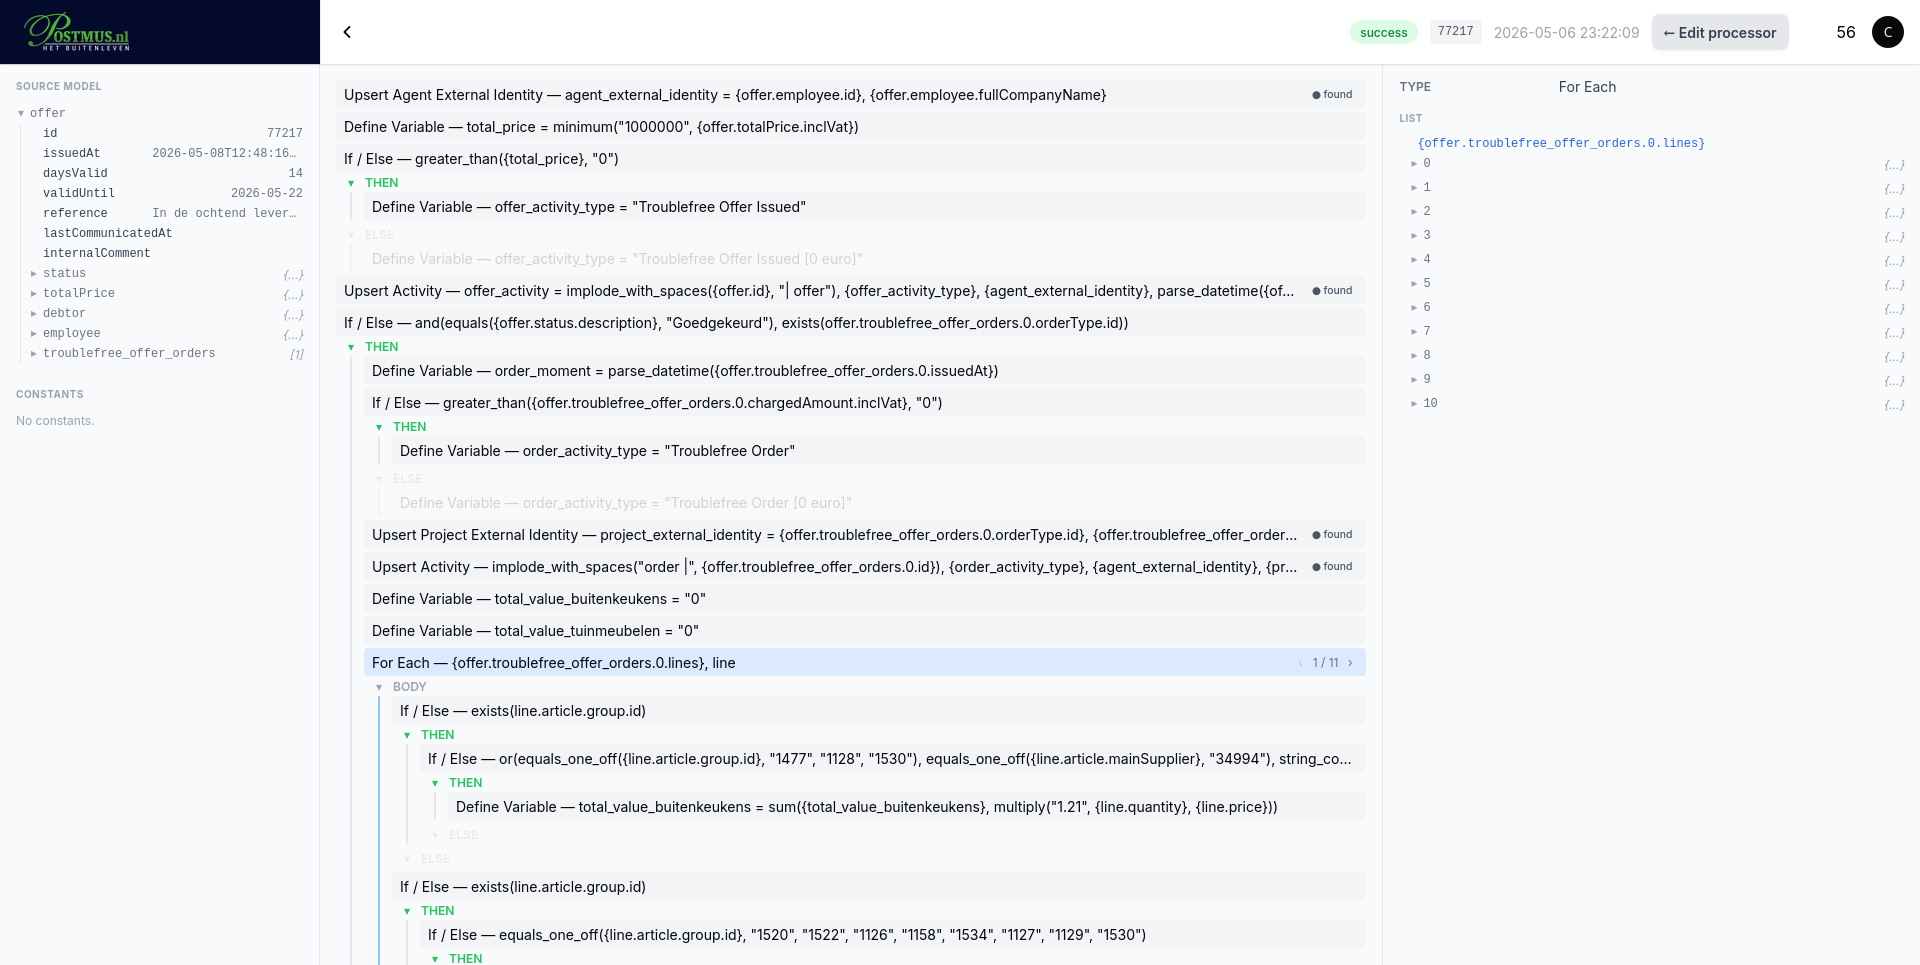
For for_each blocks specifically, the inspector's top shows the iteration count and a stepper. Move through iterations to see the body's annotations and variable values for each item — useful when one specific iteration failed and the rest succeeded.
The Test button in the topbar lets you run the processor against a historic source model right now, without waiting for the source to deliver the same record again. Pick the historic record you want to test against (using the Trace Schema picker in the left panel of edit mode), make whatever changes you want to the spec, save, and click Test. The processor runs the current saved spec against that record and produces a fresh trace — useful for verifying that a fix actually changes the outcome before you enable the processor for live data.
This is also how you do the first run of a brand-new processor: configure the source to deliver records, wait for one to come through, then keep iterating on the spec by replaying that record until the trace shows what you want.
Source models that include end-customer personal data have those fields masked in the trace viewer — you'll see redacted placeholders rather than the actual values. The validator already blocks specs from referencing those fields, and the masker is a second layer: even raw source-record values that pass through the trace pipeline never expose personal data in the viewer.