English
English

Dashboards consist of widgets. Depending on your dashboard type, you will have multiple widget types to choose from.
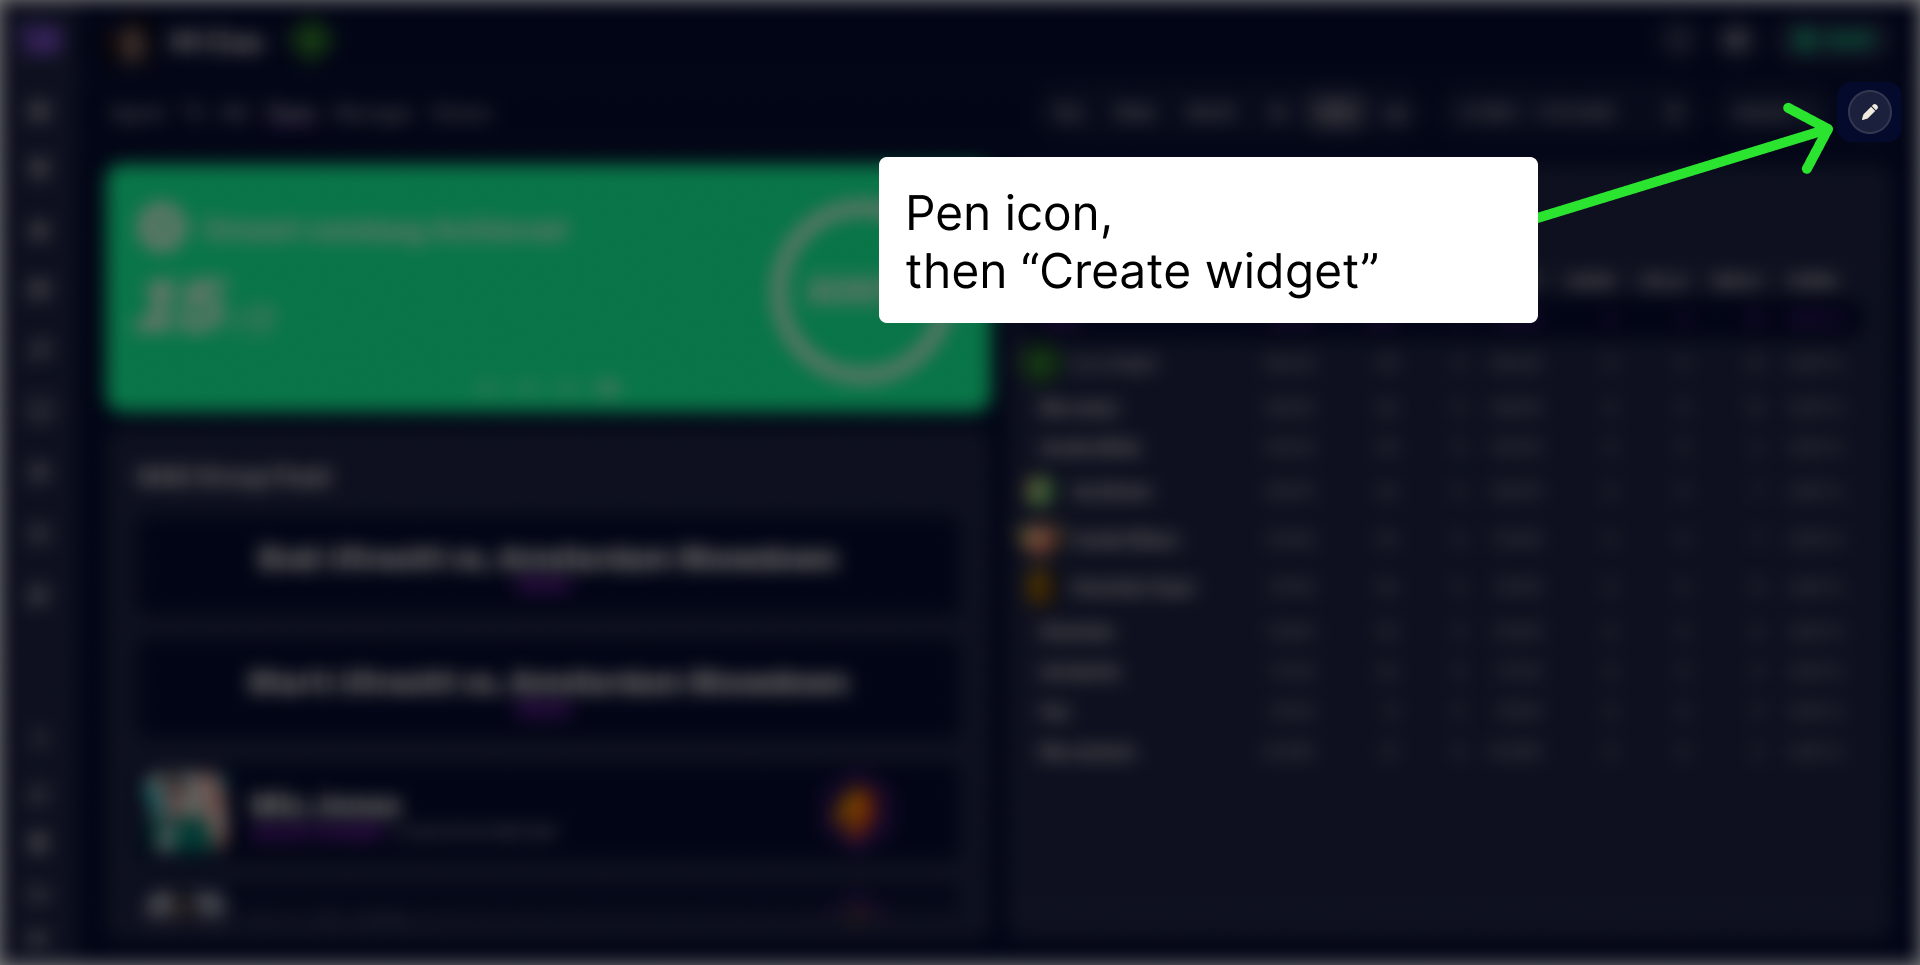
To add a widget to a dashboard, click the pen icon in the top right corner. This option is only available to admins on desktop.
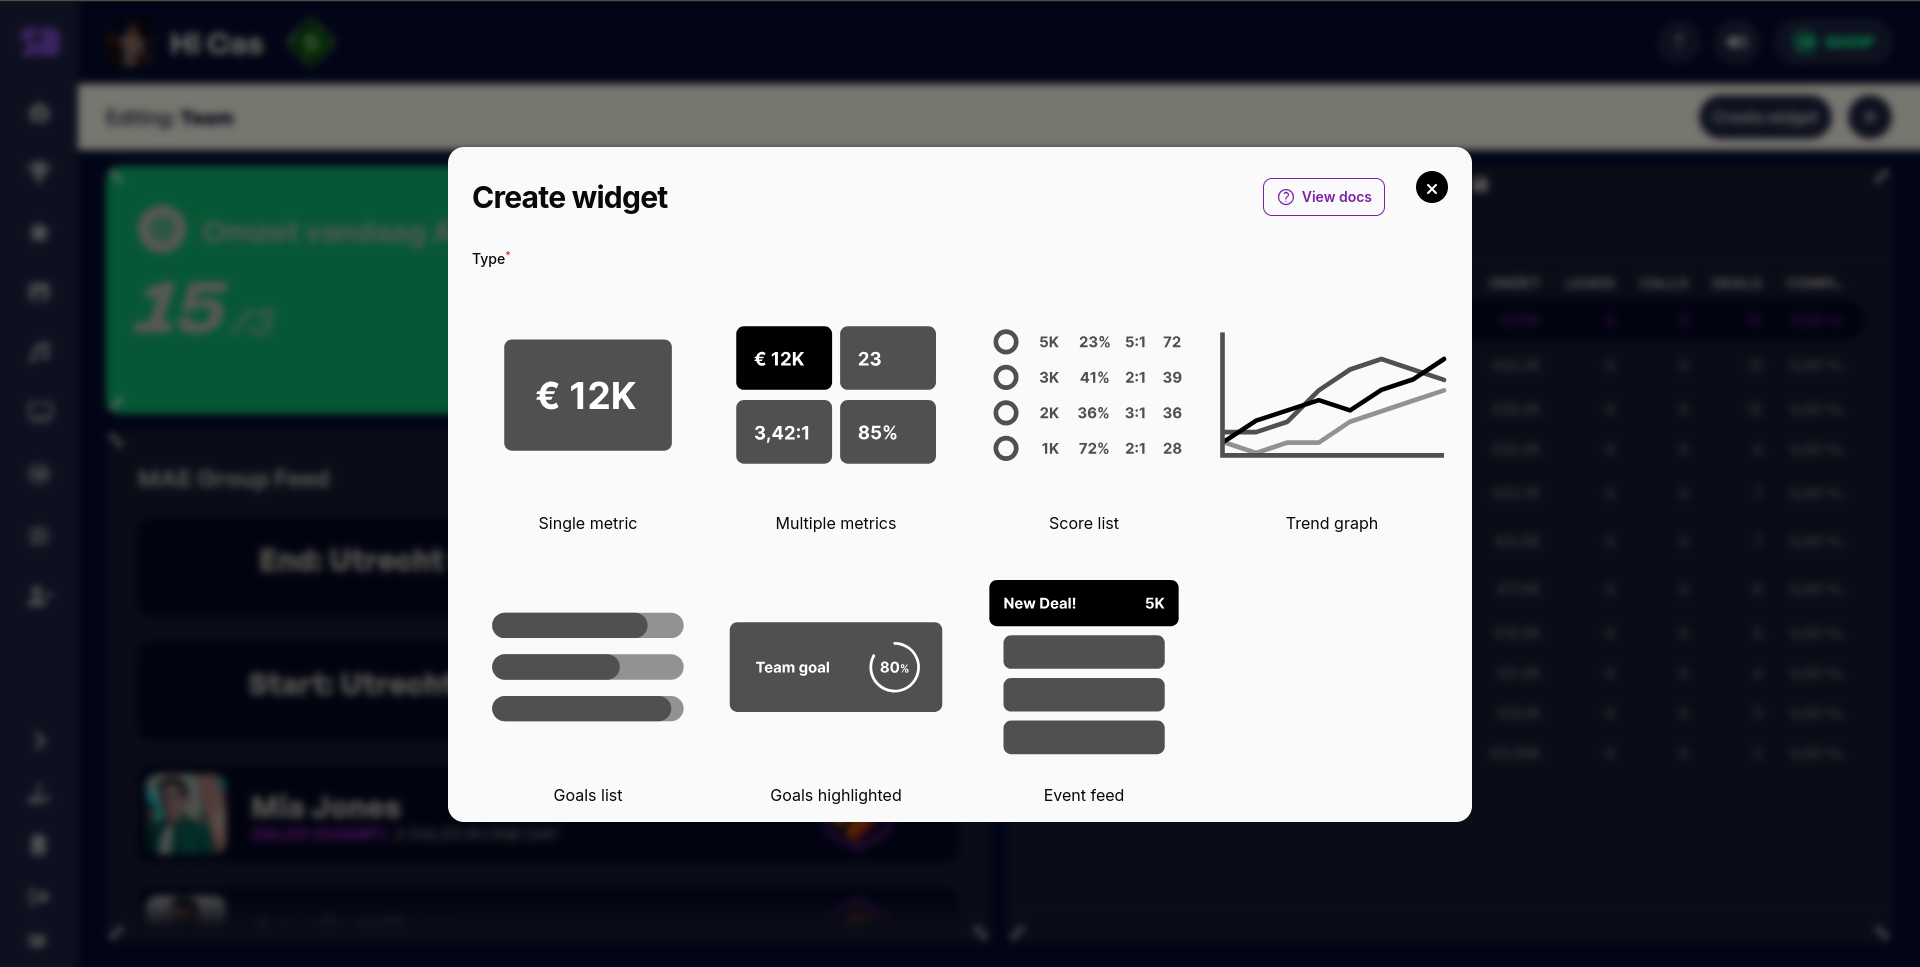
After you click "Create widget", a modal will appear where you can select the widget type and configure it.
Most widgets offer the option to configure a title. This is useful to distinguish multiple widgets of the same type, for example when displaying two categories of metrics.
Some widgets also have the option to select a "type", this is the aggregation level of the data in the widget. You usually want to set this to "Agent", selecting multiple values will allow the user to choose between them in the widget.
Some widgets have a configurable "Date filter mode". You should usually leave the date filter mode option on "Period". This way, the data in the widget will adhere to the date range filtered on the dashboard.
The most straightforward type of widget is the single metric widget. This widget allows you to display a single metric on your dashboard. All you have to do is select the metric and give it a title.
The multiple metrics widget is the same as the single metric widget, but it allows you to display multiple metrics in the same widget.
To add metrics, simply click "Add to metrics" and configure the metric as you would for a single metric widget.
To change the order of the metrics, drag and drop using the arrows on the top left of each metric.
This score list is the primary way to display scores in SalesDash. You can either configure columns for this specific widget or chose to use the global column configuration.
The global column configuration can be configured at Dashboard > Score table columns in the SalesDash admin.
To configure columns for this specific score list, click "Add to columns" and configure each column as you would a single metric widget. To change the order of the columns, drag and drop using the arrows on the top left of each column.
The trend graph allows you to display changes in a metric over time. You can select multiple metrics, the user can switch between them in the widget. The top metric will be shown by default.
The goals list widget shows the goals you have set for your team. The data in the widget will adhere to the team filter in your dashboard and it will show all the goals that overlap with your selected date range.
To configure goals, go to Gamification > Goals in the SalesDash admin.
If you have many goals and want to split them across multiple widgets — for example a "Setter goals" widget next to a "Closer goals" widget, or a daily-goals widget next to a monthly-goals widget — you can narrow the widget with two optional filters:
A goal's cadence is read from the length of its active period: a goal active for exactly one day is "daily", a goal active for 5–7 days is "weekly", and so on. Goals whose active period doesn't fit any standard cadence (for example a 14-day or 6-week goal) won't match a cadence filter — leave the cadence filter empty if you want those goals to show.
Both filters can be combined; a goal must match every selected filter to appear in the widget. The widget title stays under your control, so name each instance after what it shows.
The goals highlighted widget is functionally the same as the goals list widget, but it highlights one goal at a time. If the goal is not (yet) achieved, the whole widget will be colored with your primary color. If it is achieved, it will be colored in your highlight color.
Goals will be shown in a carousel, you can also click the button at the bottom to skip through them more quickly.
The same Metrics and Cadences filters described under "Goals list" are available here too.
This widget shows goals you fill in inside the widget itself, rather than the goals from Gamification > Goals. Per goal you give a name, a metric, a period and a target; the widget works out the value reached over that period.
That makes it the widget for goals not meant for everyone. Because the goal exists only inside this widget, it appears nowhere else — not in the goals list, not on a slide, not on the profile page and not in the API. Put the widget on a dashboard with access level Manager or Admin, and only those roles see the goal.
The widget is available on dashboards of type Unfiltered, and not on a team dashboard: it shows one company-wide figure that does not move with the selected team. If you want a target per team, use an ordinary goal from Gamification > Goals.
The value reached is not narrowed to the teams of whoever is looking, so everyone sees the same figure next to the same target. If you work with projects, only what falls inside the viewer's projects is counted.
The target is taken exactly as you type it
This field does not yet convert to the metric's unit, so enter the value the way SalesDash stores it:
0.4 for 40%.28800 for 8 hours.For plain counts and amounts, type the number you expect.
This widget shows the personal goals of everyone visible on the dashboard: per agent the goal for the selected period, with progress and the value reached next to the target. It is meant for a manager dashboard — where the "Goals (profile page)" widget lets one agent set their own goal, this one reads them all side by side.
Agents without a goal for that period sit at the bottom marked "No personal goal set", so you can see at a glance who has yet to set one. Agents with a goal come first, highest percentage at the top.
The widget follows your dashboard's team filter: it shows only active agents of the teams you may see on that dashboard.
At the top of the widget you pick the period: first the cadence (week, month, quarter or year), then the specific period. The list holds every period somebody has a goal for, plus the current and the next one.
Which cadences you can pick is set per widget under Periods. Choose the same periods as the "Goals (profile page)" widget, so the manager and the agent look at the same periods. See Personal goals.
Click an agent's name for the card with View profile, which opens their profile page — where the goal can also be changed. That button only appears if you may open that agent's profile: as an admin, or as a manager of their team.
The event feed shows all the events of the team(s) shown on the dashboard. Which events are shown can be configured in the admin at Gamification > Events.